
Your dashboard says 1,200 units available. The container you booked three weeks ago is still sitting in receiving, the reorder point you set last quarter came from a lead time your supplier quoted two seasons back, and your hero SKU has 11 days of cover left. Nothing on that page is technically wrong. That's the problem.
Amazon inventory management isn't a stock-counting exercise. It's a decision system that has to reconcile demand, inbound timing, storage capacity and fees at once. Judge it by unit count alone and it fails, usually the week before your biggest sales period.
What Amazon Inventory Numbers Actually Tell You
A SKU shows 900 units available, but current demand is 30 units a day and the next inbound shipment could take 35 days to become buyable. The available count covers only 30 days of sales. It does not account for the time needed to replenish.
Four states hidden inside one number
Amazon's FBA inventory reporting counts available, inbound, reserved and unfulfillable units together as total inventory supply, which is why a single unit count hides so much.
The buckets have different operational value. Available units can ship now. Inbound units are on their way but may not be checked in. Reserved units are committed to customer orders or internal processing. Unfulfillable units cannot be sold until the issue is resolved. A SKU with 900 available units and 600 inbound is in a different position from one with 900 available and no shipment in transit.
Sell-through adds context to the count: it shows how quickly inventory moves relative to the stock held in Amazon's fulfillment centers. A large unit balance can still be a concern if sales are slow, because units sitting in storage continue to incur costs.
Costs matter alongside demand. Fulfillment includes receiving, warehousing, picking, packing and preparing orders for shipment. Slow-moving stock can also occupy capacity that a faster-selling SKU needs. Reorder decisions should account for Amazon's capacity rules, storage fees and aged-inventory surcharges, not demand alone.
Two rules to buy by: judge stock against sales velocity, not unit count. Treat idle units as a cost, especially as they age or use capacity needed by faster sellers.
The Inventory Performance Index combines signals including sell-through, excess and aged inventory, stranded inventory, and in-stock performance. Read it alongside the SKU-level inventory states: the score gives a broader view, while the buckets show where units are and whether they can fulfill demand.
Using Restock Tools and Reports for Inbound Planning
The Restock Inventory tool returns two outputs per SKU: a Recommended replenishment QTY and a Recommended ship date. Amazon builds both from sales history, demand forecasts, seasonality and the SKU's replenishment settings, as set out in its Restock Inventory guide.
Treat that output as a model, not a purchase order. It's only as accurate as the settings behind it, and the settings are where most brands are sloppy.
Fix the settings before you trust the recommendation
Enter the supplier lead time, case-pack quantity and replenishment frequency. To update a catalog rather than one SKU, go to Inventory, then FBA Inventory, then Restock Inventory, select Customize SKU settings, generate the Inventory product settings report, edit the downloaded text file in a spreadsheet and upload it. The lead time Amazon assumes by default is rarely the lead time you get.
Replenishment limits and storage limits are different controls
Replenishment limits govern how many units you can send and are calculated by storage type from historical and forecasted sales. They're independent of the Inventory Performance Index. Storage limits measure cubic-meter capacity and can draw on sales volume, seasonality, historical IPI, weeks of cover and excess inventory (Amazon Global Selling capacity notice). A strong IPI does not buy you unlimited inbound.
Capacity isn't fixed either. Amazon says monthly limits are influenced by historical sales, seasonality, forecasts, scheduled deals, fulfillment-center capacity, shipment lead time, new selection and IPI, and Multi-Channel Fulfillment orders count toward the sales data behind them (Seller Central capacity guidance). Selling more can raise your ceiling. Dead stock can lower it.
The working sequence is: pull the FBA Inventory report for available, reserved and unfulfillable units by SKU, then the Restock report, which lists recommended products, quantities, ship dates and whether a minimum inventory level was published for the FNSKU (Amazon's FBA reporting documentation). Validate lead time and case pack, check both limit types, then approve a quantity that holds coverage without breaching capacity.
| Report or tool | Where to find it | What to check |
|---|---|---|
| FBA Inventory report | Reports menu on the FBA Inventory page | Available, reserved and unfulfillable units by SKU |
| Restock report | Reports menu on the FBA Inventory page | Recommended quantity, ship date and whether a minimum inventory level is published |
| Inventory product settings report | Restock Inventory, then Customize SKU settings | Supplier lead time, case-pack size and replenishment frequency |
| Inventory Age report | Seller Central reports | Units by age, to catch stock nearing 181 days |
| Minimum Inventory Level | FBA Inventory page, Inventory health status and recommendation column | Recommended sellable units to keep before the next shipment arrives |
Inbound to a fulfillment center is only half the journey. The middle mile between your 3PL and Amazon's network is where most timing assumptions break, and these Peak Transport middle-mile planning tips cover the handoffs worth building into your ship dates. If shipments keep getting squeezed on space rather than demand, work through Amazon FBA capacity limits explained before you book freight.
How to Calculate Your Reorder Point Step by Step
Reorder point is the sellable stock level at which the next shipment must already be in motion. Miss it in one direction and you stock out. Miss it in the other and you pay storage on units nobody needed.
Here's the shape of the calculation before the detail.
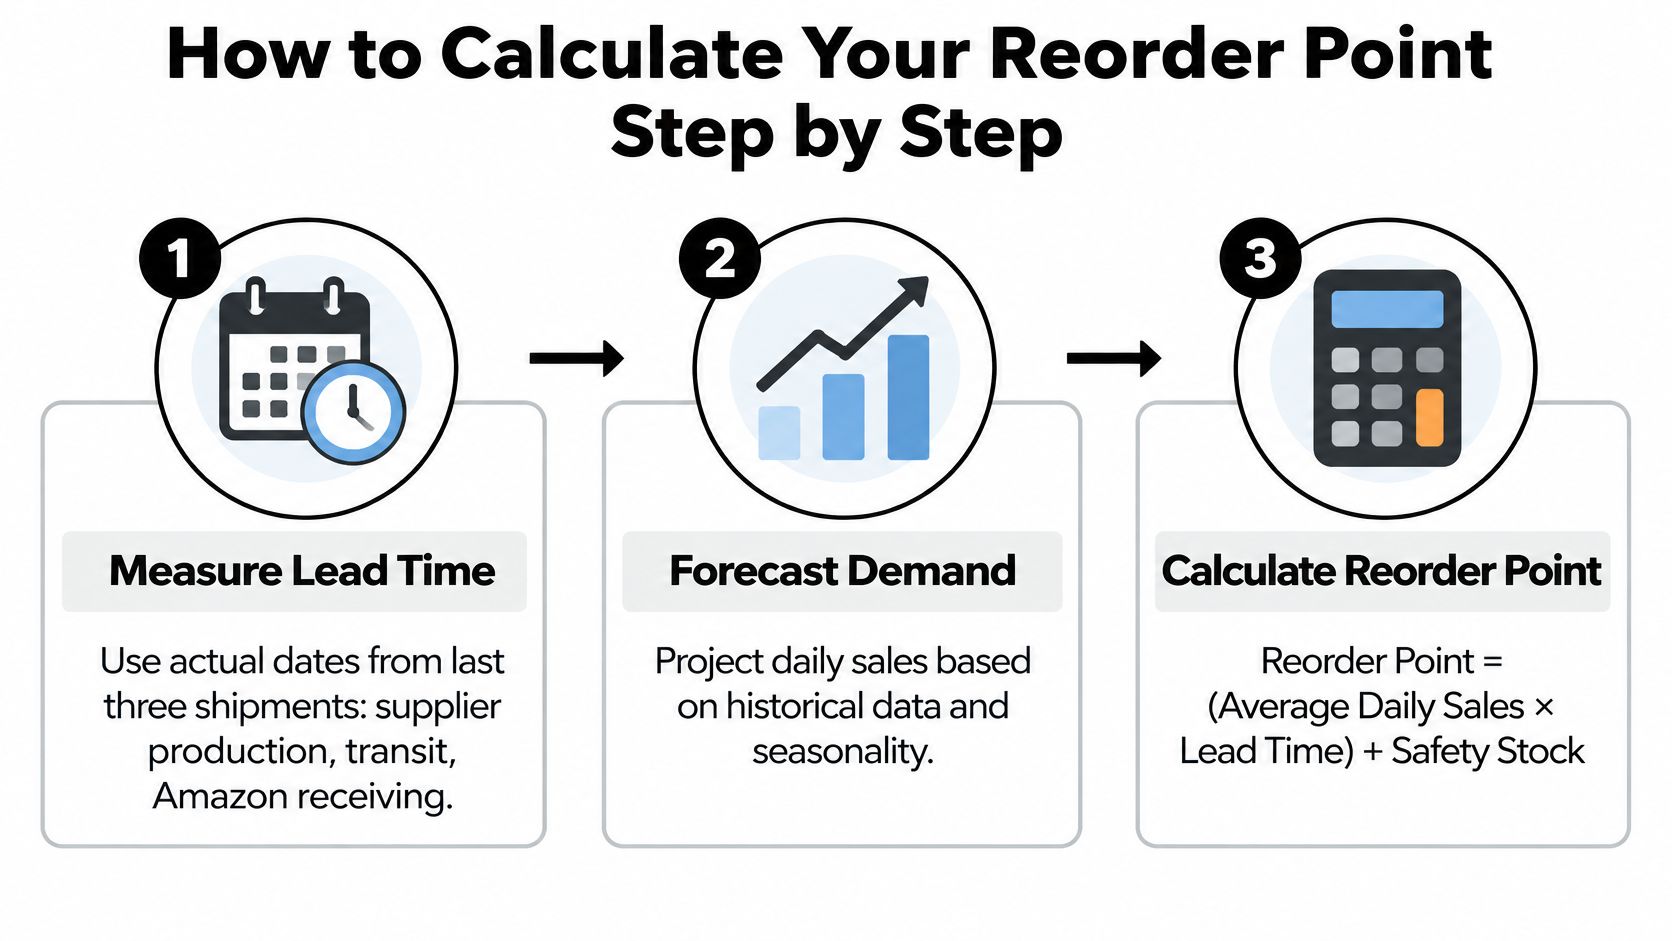
Measure real lead time from your last three shipments. Use actual dates for supplier production, transit to the Amazon warehouse and Amazon receiving. The common slip is quoting production time and forgetting receiving, which removes five to ten days from your window.
Forecast daily units per SKU and marketplace across that window. Use trailing velocity and adjust only for promotions you've already planned. Dropping unplanned deal spikes stops one good week from doubling your buy.
Multiply daily forecast by lead-time days. That gives expected demand during lead time, the amount you'll sell while the next order is in transit and being received. Nothing more belongs in this figure.
Add safety stock. Roughly 7 days of cover suits steady sellers, 14 to 21 days suits volatile or seasonal SKUs, and launches with no history need more. Buffering a launch with a mature SKU's numbers is how new products arrive late and over-ordered at the same time.
Add the two together. Demand during lead time plus safety stock is your reorder point. When sellable stock hits that number, the purchase order goes out that week, not when someone notices the listing looks thin.
Round up to case packs, then test the shipment against both limits. Rounding up to a full case is fine. Rounding past your storage limit isn't, so compare the inbound against replenishment and storage capacity before approval.
A worked reorder point
Take a SKU selling 40 units a day with a 35-day lead time and a 14-day buffer. Demand during lead time is 1,400 units. Safety stock adds 560. The reorder point is 1,960 units, and the purchase order goes out the day sellable stock touches that level rather than after a stockout email lands in your inbox.
Cross-check the result against the Minimum Inventory Level shown in the Inventory health status and recommendation column on the FBA Inventory page. Where your figure sits higher, the gap is usually lead-time optimism, and your number should win.
In our own FBA logistics work, the forecast runs by ASIN with lead-time and safety-stock buffers built in, and reorders trigger early for top products rather than at the point of scarcity. If you'd rather watch the whole loop worked end to end, this walkthrough covers it.
Weekly Stock Health Checks and the Thresholds Behind Them
Three checks help separate inventory that needs action now from stock that can wait.
Amazon defines excess FBA inventory as units with more than 90 days of supply based on forecasted demand, a threshold published in August 2024 (Amazon's seller blog on inventory-to-sales ratio).
Age creates a separate cost trigger. Amazon applies an aged inventory surcharge to FBA units stored for 181 days or longer. The Inventory Age report shows storage volume for available inventory. Capacity Monitor's storage-type usage includes available, unfulfillable and reserved units, less inventory pending removal or liquidation (Amazon's aged inventory guidance).
When Amazon does not provide a minimum inventory recommendation, plan cover from the sales forecast. Review stranded inventory and SKU settings as part of that check.
| Condition | Threshold | First action |
|---|---|---|
| No Amazon minimum inventory recommendation | Set cover from the sales forecast | Fix stranded inventory and update SKU settings |
| Excess inventory | More than 90 days of supply | Reprice, promote or pause purchasing for the SKU |
| Aged inventory surcharge | 181 days or longer in the fulfillment network | Plan sell-through, removal or liquidation before more fees accrue |
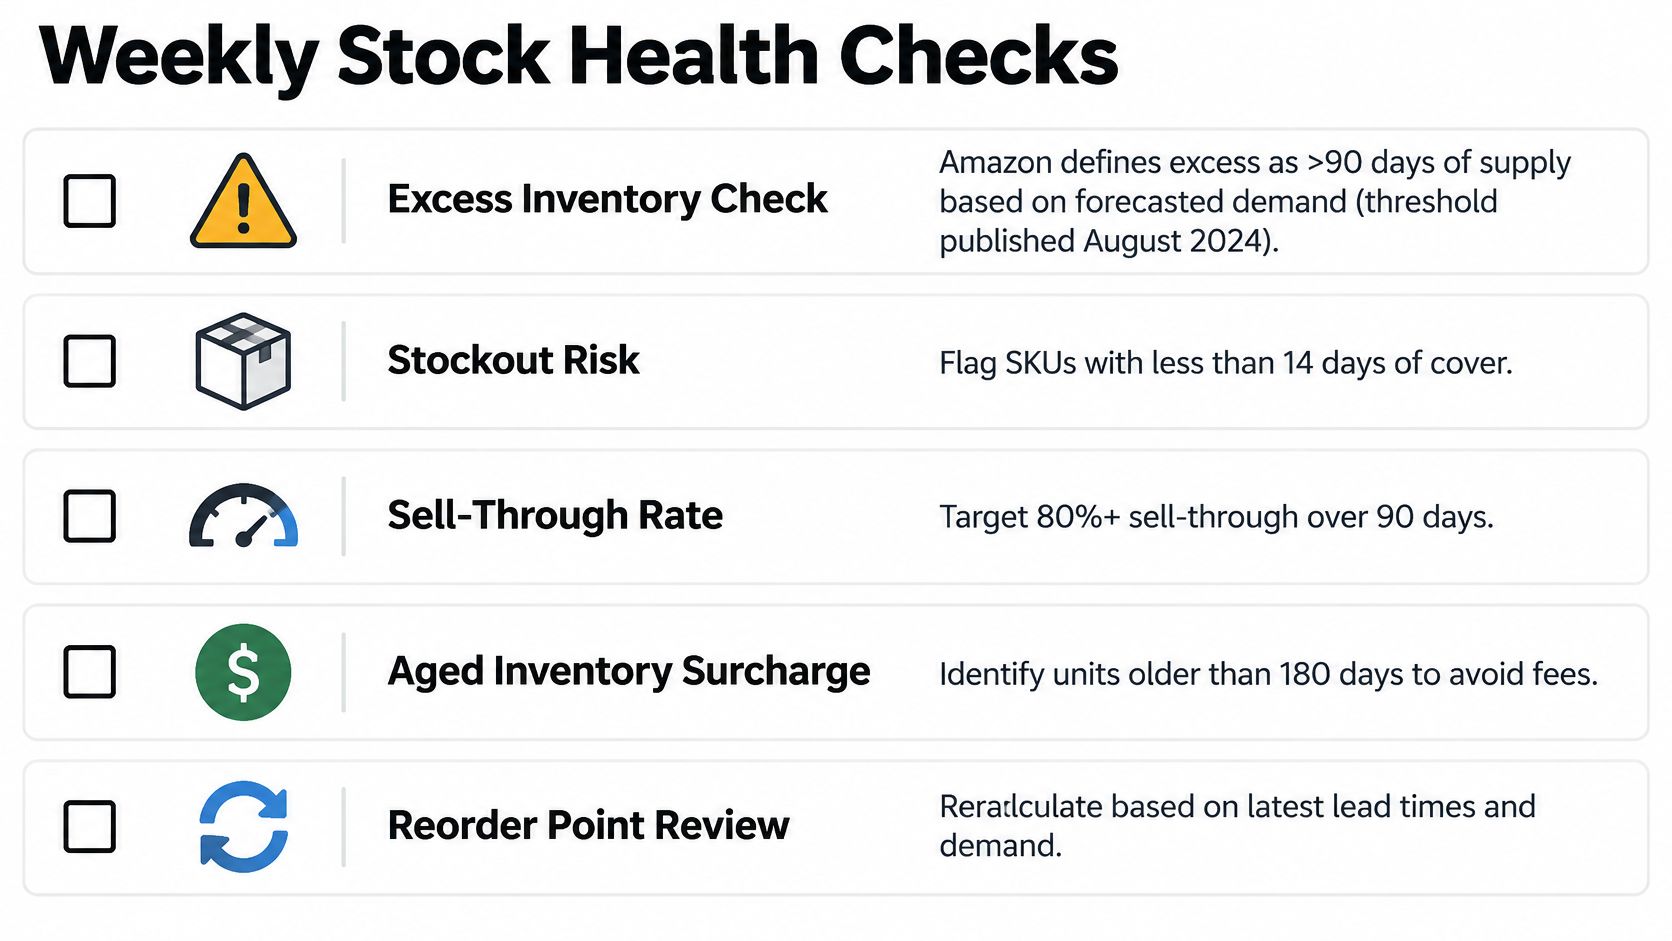
The weekly loop
- Classify by velocity, margin, seasonality and lead time. A slow, bulky SKU and a fast, compact one consume capacity differently. Apply separate purchasing rules rather than letting both compete for the same storage allocation.
- Flag projected stockouts before the next feasible receiving date. If forecasted cover runs out before inbound stock can realistically arrive, review available options against the cost of holding more inventory and the capacity available.
- Flag excess units separately. When supply moves beyond 90 days, consider repricing, promotions or a purchasing pause before approving another inbound shipment.
- Sort by age and fee exposure. Review units approaching 181 days first. Choose a sell-through plan, removal or liquidation based on the SKU's margin and storage cost.
- Reset safety stock after reviewing forecast error. Forecast performance varies by SKU and demand pattern. Use the SKU's own history to adjust buffers, especially when a product has limited sales data.
Put a dollar figure on each flagged SKU by entering its dimensions in the FBA storage fee calculator. That turns a storage concern into a cost you can weigh against the expected margin and available capacity.
When replenishment decisions span FBA, a 3PL and DTC orders, order management software basics explains the systems layer to consider before automating the workflow. For the report-by-report routine, Amazon Seller Central reports to check weekly maps the relevant pages.
Fixing Stockouts and Overstock Without Losing Margin
Every operator gets told to protect the in-stock rate. That's an incomplete target. The number that funds the business is contribution margin per SKU after storage, and availability bought with slow-moving units can cost more than the stockout it prevents.
Storage economics make that concrete. Amazon's unified monthly storage fee is calculated from daily average cubic-foot usage, applies at the FNSKU level, and increases for inventory stored longer than six months (Amazon's storage fee guidance). Volume is what you pay for, so a bulky low-price item can cost more to park than it earns.
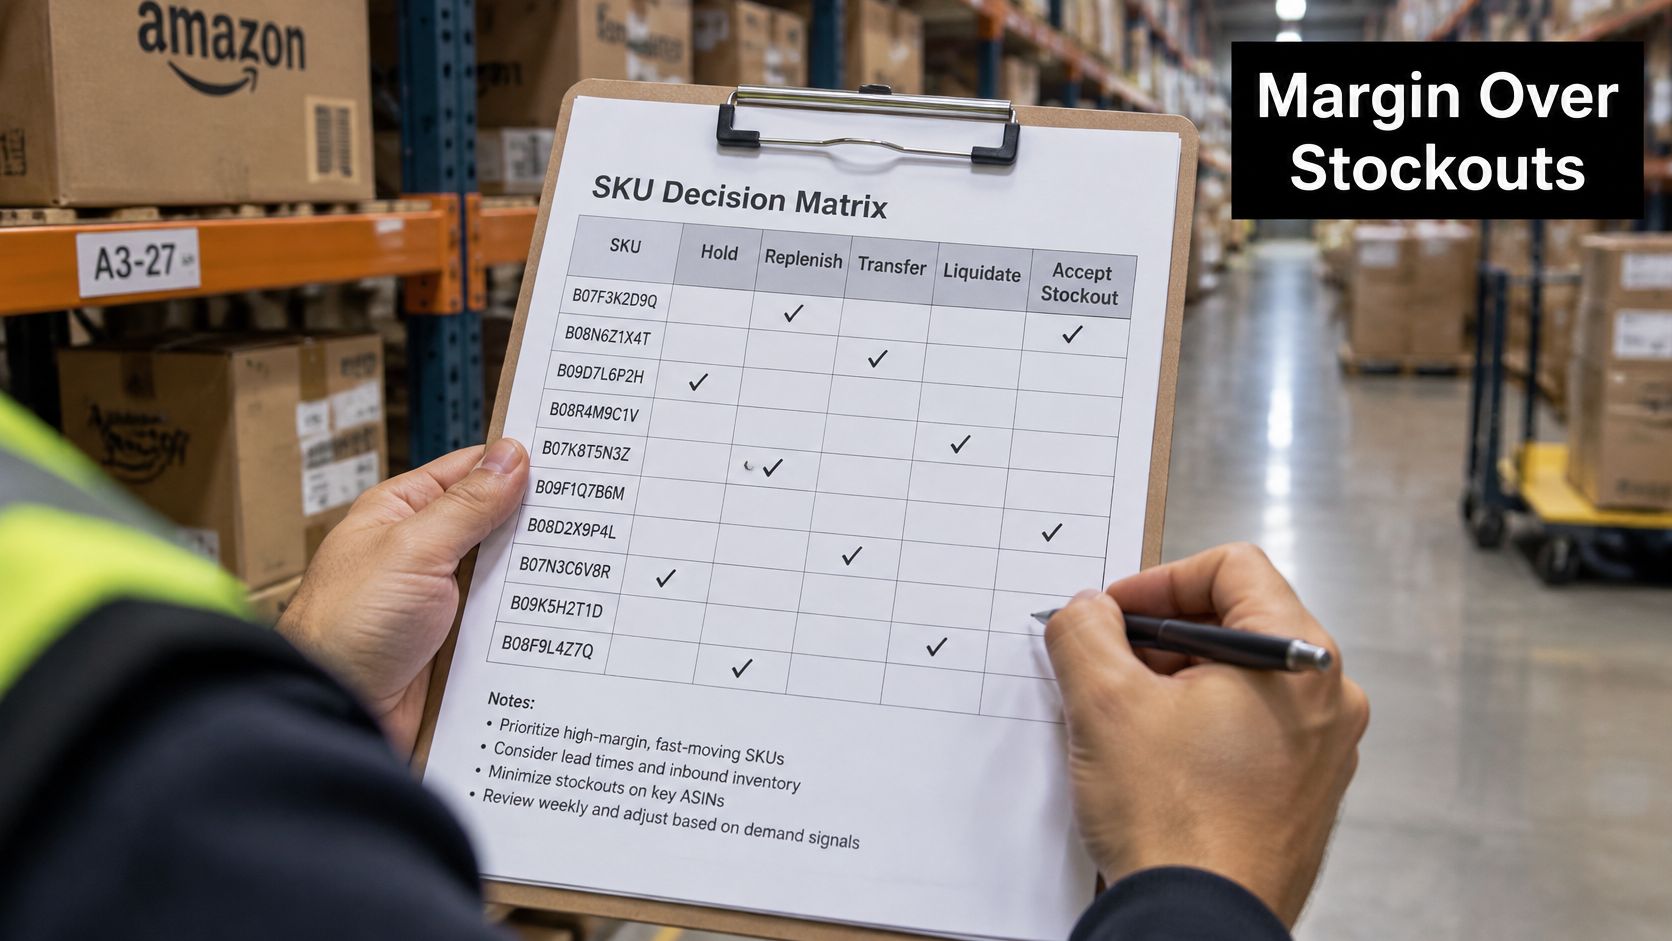
| Outcome | Choose when | Main cost to weigh |
|---|---|---|
| Hold | Margin per unit covers storage and sell-through is steady | Monthly storage fee and the aged surcharge |
| Replenish | Lost margin from a stockout exceeds the cost of holding extra units | Working capital and safety stock carrying cost |
| Transfer | Storage volume is too high for FBA economics but the SKU is still profitable | External warehousing or multi-channel fulfillment fees |
| Liquidate | Units are aged or excess and margin will not recover | Removal fees, markdown and liquidation loss |
| Accept stockout | Lost margin is smaller than the storage and markdown cost of keeping units, for a short window | Lost sales and possible rank decline |
Two SKUs make the matrix real. A furniture accessory at 18% contribution margin sitting in oversize storage can hand its entire margin to fees before it sells, so holding it is a slow loss. A compact high-margin SKU with the same demand volatility can carry three weeks of safety stock profitably, because its storage cost is a rounding error against the margin it protects.
Where the stock sits matters as much as how much
Alternatives to FBA space exist and each has a condition. Amazon Warehousing and Distribution suits bulk inventory that needs cheap upstream storage with automatic replenishment into fulfillment centers. External warehousing works when cubic volume is the binding constraint and you can replenish in smaller, more frequent sends. Multi-channel fulfillment earns its place when the same stock has to serve non-Amazon orders without a second buy.
Run the hold-versus-liquidate comparison through the Amazon profit calculator before committing units to a promotion or a removal. Put the removal fee and the expected markdown per unit into every scenario, because those two numbers set the break-even point.
A deliberate stockout is a legitimate decision when it's short, planned and cheaper than the storage and markdown cost of keeping the units.
The trade-off is real in both directions. Inventory turnover is the metric that tells you whether you're funding growth or warehousing it, and inventory turnover ratio explained covers how to read it against margin by SKU.
Confirm Your Reorder Dates Before the Next Inbound Window
Before the next inbound window, check that your reorder dates account for both demand and Amazon's capacity and storage constraints. Work through these five actions this week:
- Rank your ten most important SKUs by sales or storage exposure using the FBA Inventory report. Prioritize the products where a stockout or excess inventory would have the greatest impact.
- Recalculate each reorder point using measured lead times from your last three shipments rather than quoted timelines.
- Compare your calculation with the Restock report row and the published minimum inventory level for each FNSKU. Investigate any gap larger than one case pack.
- Set a plan for flagged SKUs before approving more units. If a product is past the 90-day supply line or approaching the aged-inventory surcharge, weigh its storage costs against expected sales before sending more stock.
- Lock peak purchase orders before the inbound window closes. Amazon communicates capacity ahead of each allocation period, so order timing needs to account for available space as well as supplier lead time.
Shipment creation, labeling, and inbound management belong in the same planning workflow. When one owner can see the forecast alongside freight coordination, reorder timing can reflect both demand and inbound constraints.
Online Brand Growth manages FBA inventory planning and replenishment as part of its Amazon channel services, including demand forecasting by ASIN and inbound management. Its team works through planning, Seller Central workflows, and coordination with a brand's 3PL and freight partners; it does not physically handle client inventory. Contact Online Brand Growth to discuss how its FBA planning team can assess reorder points and an inbound plan against your reports.