
The popular advice to lower ACoS and watch TACoS fall can leave you with a smaller, less profitable Amazon business. Cutting discovery spend can make a campaign look better while reducing demand, and a rising TACoS can be a deliberate investment rather than evidence of waste. Trust ACoS to guide paid-traffic decisions, and use TACoS to diagnose the business, but only after the reporting window has closed.
What ACoS and TACoS Each Measure
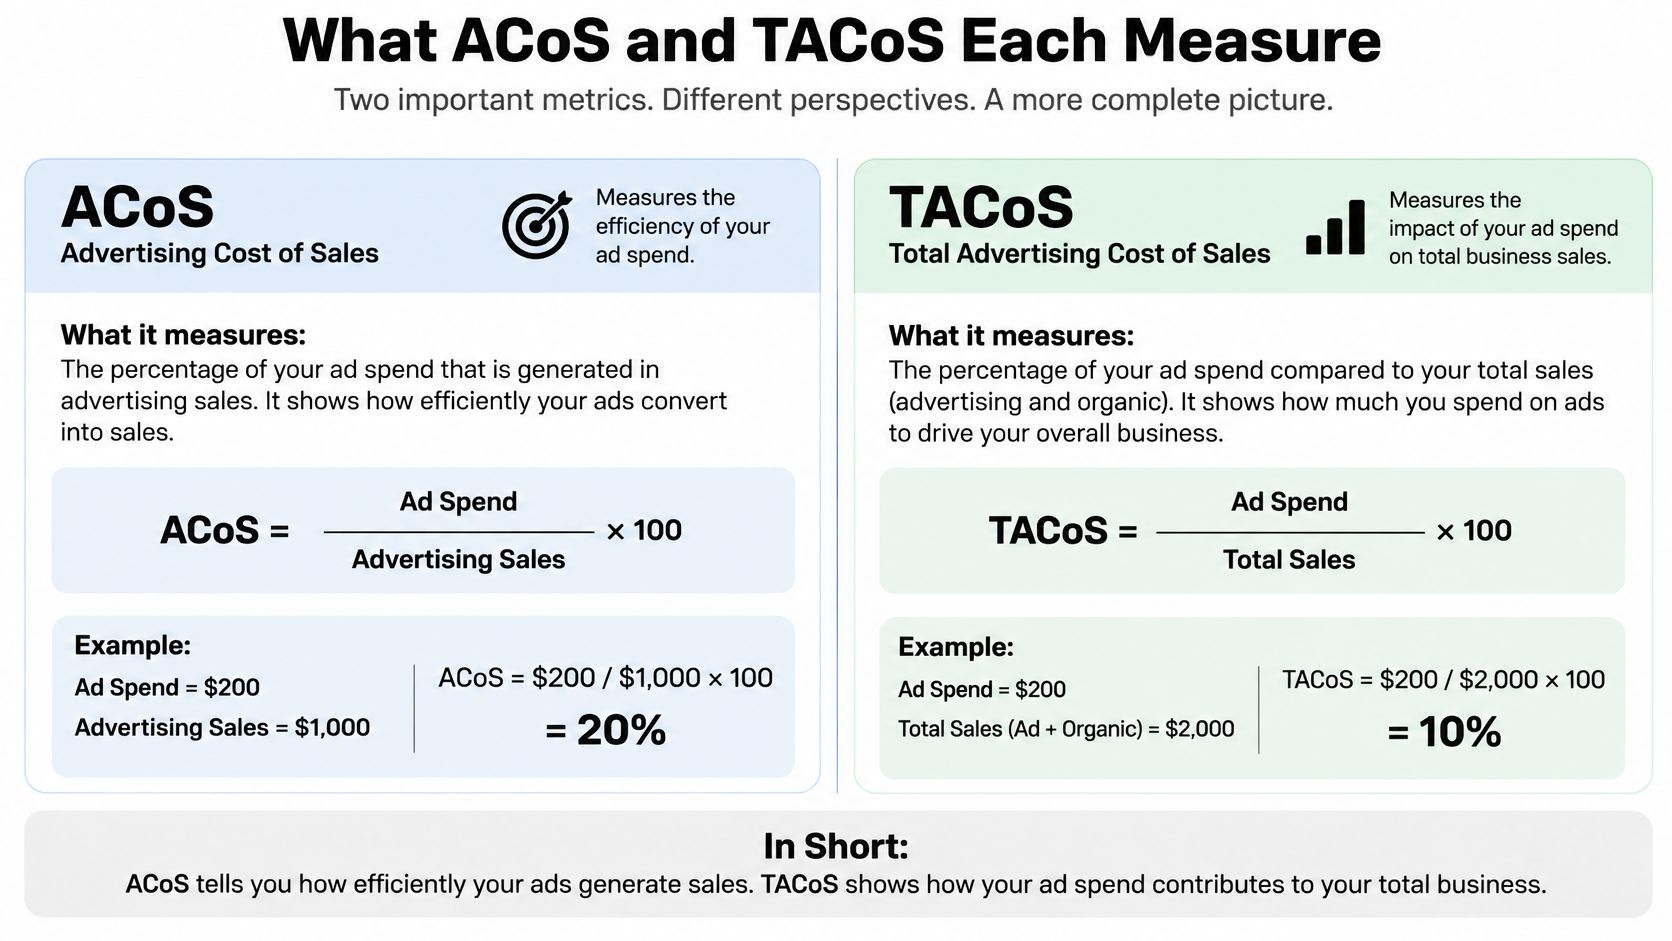
Start with the same account and the same spend. In the AdTestBench TACoS guide, $1,000 in advertising spend against $4,000 in ad-attributed sales produces 25% ACoS; against $10,000 in total sales, including organic purchases, that spend produces 10% TACoS.
ACoS versus TACoS at a glance
| Criterion | ACoS | TACoS |
|---|---|---|
| Formula | Ad spend divided by ad-attributed sales | Ad spend divided by total sales |
| Worked example | $1,000 / $4,000 = 25% | $1,000 / $10,000 = 10% |
| Level | Campaign, ad group, target, or advertised ASIN | Account, brand, or ASIN total business |
| What improves it | Less spend or more attributed sales | Less spend or more total sales, including organic |
| Blind spot | Ignores organic sales and ad dependence | Cannot prove ads caused the organic orders |
The formula changes only at the denominator. ACoS, advertising cost of sales, measures spend against revenue Amazon attributes to advertising. TACoS, total advertising cost of sales, compares advertising spend with the entire sales base.
That denominator determines where each metric belongs. Use ACoS in Sponsored Products, Sponsored Brands, and Sponsored Display reporting to evaluate campaigns, ad groups, and targets, where those reporting dimensions are available. Use TACoS at account, brand, or ASIN level to judge the advertising burden on total ordered product sales.
The visual distinction is straightforward:
What changes the ratios
Say the example account keeps ad spend at $1,000 and attributed sales at $4,000, but total sales rise to about $14,000. ACoS remains 25%, while TACoS falls to approximately 7%. No campaign became more efficient in that scenario. The business generated more revenue outside the attributed-sales denominator.
The reverse matters just as much. If total revenue stays flat while you spend more to maintain it, TACoS rises, even when campaign ACoS remains within your target. You're buying a larger share of an unchanged business, which deserves investigation before anyone celebrates the campaign dashboard.
Practical rule: A lower ratio is useful only when you understand what changed in its numerator and denominator.
For brands running paid media beyond Amazon, NotFair's resource on blended ROAS reporting for paid media provides useful context for separating platform-attributed performance from broader business performance. Keep the scope explicit, though: Amazon TACoS should use Amazon sales, not unrelated DTC revenue.
Neither percentage tells you what remains after product cost, FBA fulfillment, referral fees, storage, returns, and coupons. A campaign can meet its ACoS target while the ASIN loses contribution dollars, and a low TACoS can sit on top of deteriorating sales.
ACoS sets the bid on each campaign and target, while TACoS shows whether the whole ASIN can carry that spend. Neither replaces a margin calculation.
How to Calculate Both on Closed Dates
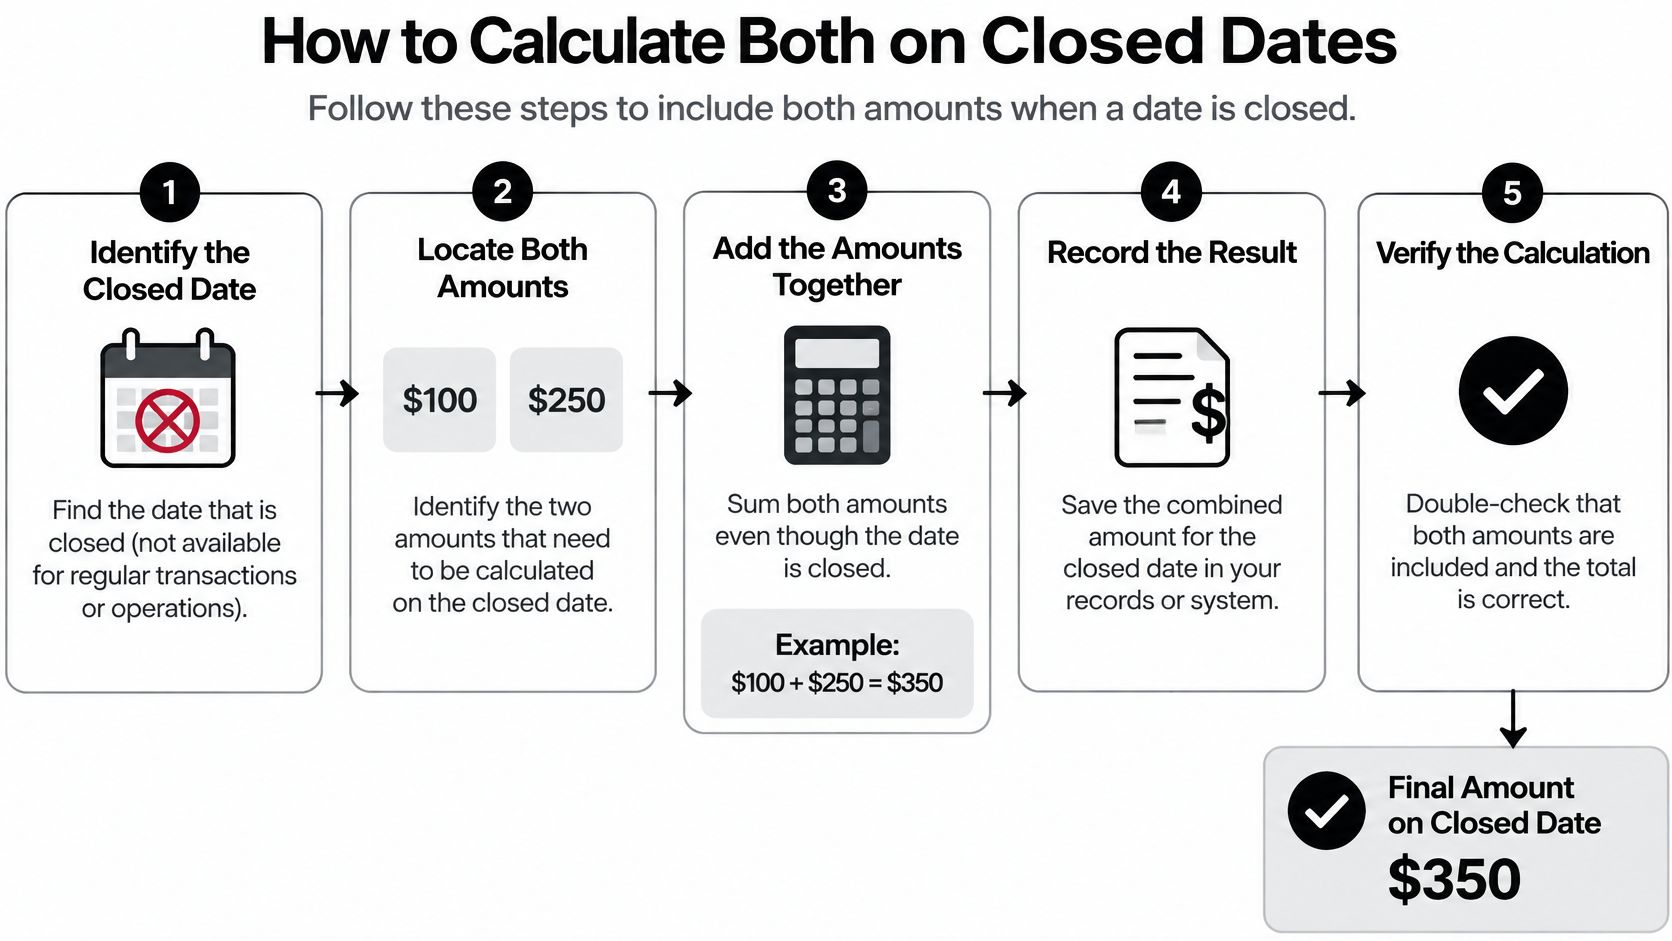
A ratio pulled on an open window measures missing data, not performance. Attributed sales keep landing for days after the spend, so ACoS calculated this morning on last week's clicks reads worse than the campaign will eventually settle at, and TACoS reads worse still. Run both numbers only on dates where the attribution window has closed.
Build a repeatable reporting routine
Choose a sufficiently closed date range. For Sponsored Products seller campaigns, start with a range that ended at least 14 days ago, consistent with Amazon's Sponsored Products report definitions. A click on October 3 can receive credit for an order on October 17, while an October 18 order falls outside that stated window. Amazon attributes campaign sales to the ad-interaction date rather than the order date, and says conversions can take up to 12 hours to appear. Recent ACoS therefore looks worse before delayed sales arrive.
Export total sales from Seller Central. Open Reports > Business Reports > By Date or By ASIN and export ordered product sales for the selected range. Keep the marketplace, currency, and product scope consistent with the advertising export you pull next.
Export advertising results for identical dates. In Amazon Ads, download the relevant campaign or advertised-product report with spend and attributed sales. Include the advertising programs your TACoS definition covers, and hold that definition steady between reviews. DSP or another spend source still belongs in the numerator if your definition counts it, even when it sits outside the familiar campaign view.
Calculate both ratios at matching levels. Divide spend by attributed sales for ACoS, and divide spend by Business Reports sales for TACoS, expressing each as a percentage. Run the account figure and the figure for each hero ASIN. If a denominator is zero, flag it for review instead of presenting a misleading percentage.
Check the operating conditions before judging performance. Review units, returns, price changes, promotions, and stock availability. Verify that the advertised ASIN mapping matches the sales export, especially where variations or cross-catalog purchases complicate attribution.
Use this workflow to keep the inputs aligned:
Keep date alignment separate from attribution
Matching date filters never makes click-date advertising sales identical to order-date Business Reports sales. What it gives you is a consistent operating comparison; a perfectly reconciled order ledger would take different data.
Don't pair a finished sales month with an immature ad week, particularly around a launch, coupon, or high-consideration purchase. Keep a reporting cut-off in the workbook so everyone knows which periods are ready for decisions. Treat Fee and Economics Preview as a forecast, with the historical exports above as the reconciliation source.
A rising TACoS on properly closed dates is a diagnosis, not proof of waste. Split the change by product life cycle and by branded versus non-branded traffic before you treat it as overspend, and confirm the ASIN's contribution margin can carry the spend at all.
The walkthrough below shows the calculation end to end:
A lower TACoS calculated from mismatched dates isn't evidence of an organic halo. It reflects a reporting problem until the periods and product scope agree.
2026 ACoS and TACoS Benchmark Ranges
| Sample | Median ACoS | Median TACoS | Middle or full range |
|---|---|---|---|
| 14 accounts, Nov 2024 to Apr 2026, reported in MrPrime's benchmark review | Not reported | 9.8% | Middle 50%: 7.4% to 17.7%; full: 2.6% to 43.1% |
| 150 U.S. brands, 90 days in 2026, in the same review | 28.4% | 10.6% | Middle 50% of TACoS: 8.1% to 12.8% |
2026 published ACoS and TACoS benchmarks are reference points, not operating targets. The smaller longitudinal sample covers 156 account-months, while the larger brand sample covers a shorter observation window. A separate account-level review covering the first half of 2026 reported higher medians on both measures, which fits a book of accounts weighted toward growth-stage spending. Those samples aren't interchangeable views of the same population.
The gap between samples is more useful than any single average. Account selection, category, product maturity, and growth objectives move the result substantially. A catalog harvesting established demand carries a different advertising burden than a brand pushing into unfamiliar search terms, and holding both to one midpoint tells you nothing.
Use the spread to ask better questions
A TACoS below the lower part of a benchmark band may reflect strong organic demand, but it may also reflect underinvestment. A result above the upper part may be a controlled launch or a deliberate market-share purchase, or it may mean paid traffic is replacing lost organic orders. Treat a rising TACoS as a diagnosis to run down before you treat it as waste.
You can't tell which explanation applies from the percentage alone. Pair the ratio with the following:
- Organic-sales direction: Is revenue outside advertising attribution growing, shrinking, or merely changing classification?
- Life-cycle stage: Is the spend supporting an established hero, a new ASIN, or a category expansion?
- Branded versus non-branded traffic: Is TACoS climbing because defense spend on your own name increased, or because discovery terms got more expensive?
- Conversion conditions: Have price, availability, reviews, or listing content changed?
- Contribution dollars: Is the business retaining more money after advertising and variable costs?
Category context helps narrow the comparison. Use our Amazon TACoS benchmarks by category as a starting point, then favor your own product economics over a published midpoint.
Compare against your own baseline
Mark your trailing closed reporting period against the relevant middle band, and annotate launches, promotions, stockouts, and changes in spend coverage. Hold the ACoS side to a closed window too, because a settled TACoS month stacked against an immature ad week measures attribution lag, not decline. Keep the benchmark itself consistent rather than switching samples whenever a different one makes the account look healthier.
The operating decision isn't whether your TACoS beats someone else's median. It's whether the next dollar of spend produces enough contribution, discovery, and durable demand to justify itself. Don't cut a productive segment to reach a benchmark, and don't scale an unprofitable segment because its ratio looks ordinary.
Break-Even ACoS From Contribution Margin
A 30% gross margin doesn't automatically support 30% ACoS. Revenue isn't the same as the cash available to buy an order, and a gross-margin figure that excludes fulfillment, referral fees, storage, returns, or coupons overstates your advertising capacity.
Build the ceiling from the ASIN's cost stack
Take a hypothetical $40 ASIN that leaves $12 before advertising, after product cost, Amazon fees, fulfillment, a returns allowance, and promotions. Its break-even ACoS is $12 divided by $40, or 30%. Use the cost categories supported by Amazon's Fee and Economics Preview documentation to validate the inputs rather than borrowing a category margin.
| Paid-order scenario | Advertising cost | Contribution after advertising |
|---|---|---|
| 20% ACoS | $8 | $4 before fixed overhead |
| 30% ACoS | $12 | Break-even before fixed overhead |
| 35% ACoS | $14 | Loss of $2 before fixed overhead |
The calculation isn't complicated. The difficult part is making the cost stack honest, especially when discounts and return allowances sit in different reports.
Rebuild it with the costs that apply to your offer:
- Product cost: Use the appropriate landed cost, not just the factory invoice.
- Amazon selling and fulfillment costs: Include referral fees and the relevant fulfillment charges.
- Returns and promotions: Allow for return economics, coupons, and other offer funding.
- Storage: Include inventory-related costs when they materially affect the product's contribution.
Our contribution-margin calculation guide explains how to keep that boundary consistent. The free Amazon profit calculator helps organize price, fees, and margin, while the FBA storage fee calculator shows monthly storage cost by dimensions when inventory size or age is consuming the same contribution.
Add the whole-product view
In the same hypothetical product model, $2,000 of advertising against $25,000 of total sales produces 8% TACoS. That can coexist with a campaign ACoS near break-even because total product revenue includes a substantial sales base outside advertising attribution.
Don't interpret that as permission for unlimited campaign losses. Check whether the ASIN's total contribution after advertising is improving, and whether the paid segment is serving a clear purpose. A strong organic base can subsidize waste just as easily as it can fund useful discovery.
Amazon's Fee and Economics Preview provides a forward view of estimated sales, supported advertising costs, per-unit costs, and net proceeds by MSKU, with forecasts extending up to 120 days. Those estimates help planning; they aren't historical TACoS.
Set the ACoS ceiling from contribution dollars, then use TACoS to see whether that ceiling is funding the whole ASIN or only the paid slice.
When a Higher TACoS Is Still Rational
| Pattern | Plausible cause | Check before cutting |
|---|---|---|
| TACoS up, total sales up | Launch, expansion, or share push | Margin versus break-even and rank gains |
| TACoS up, total sales flat | Organic weakness or heavier paid dependence | Brand versus non-brand split |
| TACoS down, total sales up | Organic growing faster than spend | Whether the growth is incremental |
| TACoS flat, sales held by brand terms | Defense hiding weaker discovery | New-to-brand share and organic rank |
How to read a TACoS move starts with a distinction: a higher ratio doesn't, by itself, prove that advertising became less efficient. Your team may have deliberately bought access to new customers, launched another product, or defended demand while organic visibility weakened.
SellerPlex's benchmark discussion reports 15% median TACoS and 38% median ACoS across 38 U.S. accounts in the first half of 2026, compared with 10.6% and 28.4% across another sample of 150 U.S. brands. Neither TACoS median can be a universal ceiling when the account mix and objectives differ.
Diagnose the segment before changing the budget
Separate launch, mature-product, and defense spend before interpreting the blended move. Then split branded from non-branded traffic within those groups. A profitable mature ASIN and a deliberately loss-making launch shouldn't receive the same instruction because they share an account.
For rising TACoS with rising sales, check contribution after advertising, organic-rank movement, and conversion rate. You're looking for evidence that expansion is creating a commercially useful result, not adding expensive orders.
For rising TACoS with flat sales, inspect the hero ASINs and branded terms first. A weak offer, lost availability, or declining discovery may be forcing the team to spend more to preserve revenue. Cutting everything proportionally won't fix the underlying problem.
TACoS mixes advertising spend with total Amazon sales. It cannot distinguish an organic order caused by advertising from one that would've happened anyway, or from credit shifted among Sponsored Products, Sponsored Brands, Sponsored Display, and Amazon DSP.
Stable ratios can hide deterioration
Flat TACoS isn't reassuring if branded queries account for more of the revenue while non-branded discovery weakens. The business may be maintaining current demand without replenishing it.
A useful evidence set includes the branded versus non-branded split, new-to-brand share where available, rank movement, conversion rate, and contribution outcomes on a closed date range. Repeat-purchase value can inform the investment decision, but don't use an assumed lifetime value to excuse losses you haven't bounded.
The operator's question is which segment's incremental margin changed, not whether the blended percentage moved.
Match Spend to Launch, Hero and Defense Weekly
Your weekly budget decision should name the situation, the expected outcome, and the condition that would make you change course. An account-wide ACoS target skips those decisions and gives the team an incentive to favor easy attributed revenue.
Launch spend needs a defined loss budget
For a hypothetical launch, a brand could choose an initial 60 to 90-day investment period. That's a planning choice, not a universal Amazon ramp-up rule. The important requirement is to agree on the affordable loss before increasing spend.
A launch may run above its contribution-based ACoS ceiling while the team develops keyword relevance and reaches new customers. Accept that only while the intended signals are moving: relevant search visibility, new-to-brand orders where measurable, conversion quality, and total contribution relative to the approved investment. A rising TACoS during this window is a diagnosis to read, not proof of waste.
Write down what would stop the test. That might be persistent poor conversion after fixing the offer, no useful rank movement, or insufficient contribution potential at the attainable selling price. Don't keep extending the launch budget because the ASIN hasn't reached an arbitrary age.
Once the product holds useful organic visibility with less paid support, change the target. Continuing to buy launch-level exposure after the product matures can turn a deliberate investment into an unexamined subsidy.
Mature heroes should earn their budget
For an established hero, compare campaign and target ACoS with the ASIN's contribution ceiling. Then inspect product-level TACoS alongside total sales and the organic-sales share. The account average shouldn't excuse a hero that consumes disproportionate spend without retaining enough contribution.
Use the free sales rank checker to examine rank movement alongside the sales trend. A falling ratio after a budget cut isn't a win if demand and visibility also weakened.
Before changing bids, inspect the retail conditions:
- Offer quality: Check price, coupon changes, and the Featured Offer, often called the Buy Box.
- Availability: Confirm the ASIN stayed purchasable and that inventory constraints didn't distort conversion.
- Listing performance: Inspect sessions, conversion, images, and the relevance of the traffic being purchased.
- Spend concentration: Identify targets taking budget without producing the intended contribution or discovery outcome.
These checks belong inside an Amazon advertising strategy that connects media decisions with catalog and inventory operations. Bids can't compensate indefinitely for an offer customers don't want or can't buy.
Branded defense needs restraint and evidence
Low ACoS on brand terms can flatter the account because those shoppers already know what they want. Keep a deliberate defense budget, but don't let that performance conceal weak non-branded acquisition.
To assess incrementality, change one clearly defined segment while holding the rest of the operating conditions as stable as practical. A time-based holdout can help compare reduced branded support with normal support; geographic holdouts may be useful where the advertising setup supports them. Monitor total sales and contribution, not just the campaign's attributed revenue.
The Amazon Growth Lab discussion of TACoS measurement emphasizes the need to distinguish correlation from incrementality using controls, branded splits, new-to-brand measurement, and profit outcomes. Promotions, external traffic, and overlapping advertising formats can otherwise change who receives credit without changing customer demand.
Unauthorized sellers require a different response. If reseller activity disrupts pricing or the Buy Box, investigate that before raising bids to compensate. Online Brand Growth handles enforcement against unauthorized resellers to protect MAP and the Buy Box, and an enforcement problem shouldn't automatically become a larger advertising budget.
Set targets together and report the exceptions
At Online Brand Growth, we optimize PPC toward each client's profitability goals rather than a one-size-fits-all ACoS target. We set targets together with the client and report against them every week.
The weekly report should show campaign and target ACoS against the relevant ASIN contribution ceiling, plus TACoS on matching closed dates. Split the view by launch, hero, and branded versus non-branded traffic, then attach margin, rank, and organic-share context. Comparing a fresh TACoS reading against an ACoS window that hasn't closed yet will mislead the decision.
Name the decision beside each exception: hold, reduce, test, fix the offer, or fund further discovery. Never publish one account-wide ACoS target as though every product and search term has the same job.
Online Brand Growth connects Amazon PPC management with contribution-margin targets, catalog performance, and weekly reporting. Book a free strategy call and bring the last closed 90 days of spend, attributed sales, total sales, and contribution remaining on your top ASINs.